About the Contributors
The Chinatown Arts & Culture Coalition and the Chinese Culture Center of S.F. invited their constituents to participate in the open call from January to June 2020. Thirty-one people contributed their stories of belonging. Here are snapshots of the contributors and their responses.
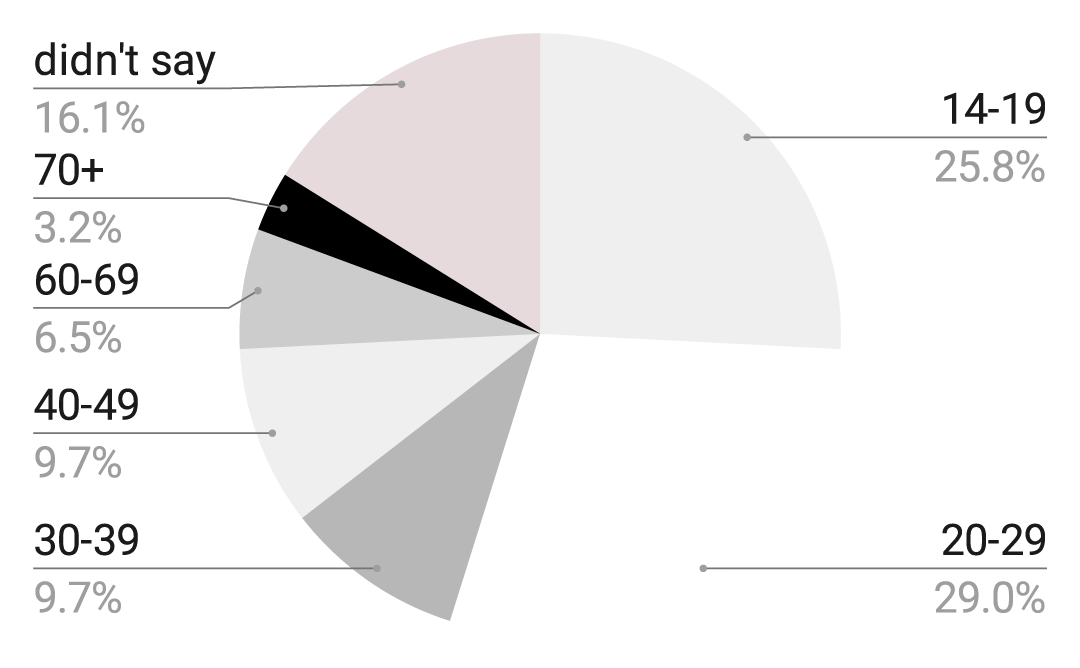
Age
Gender
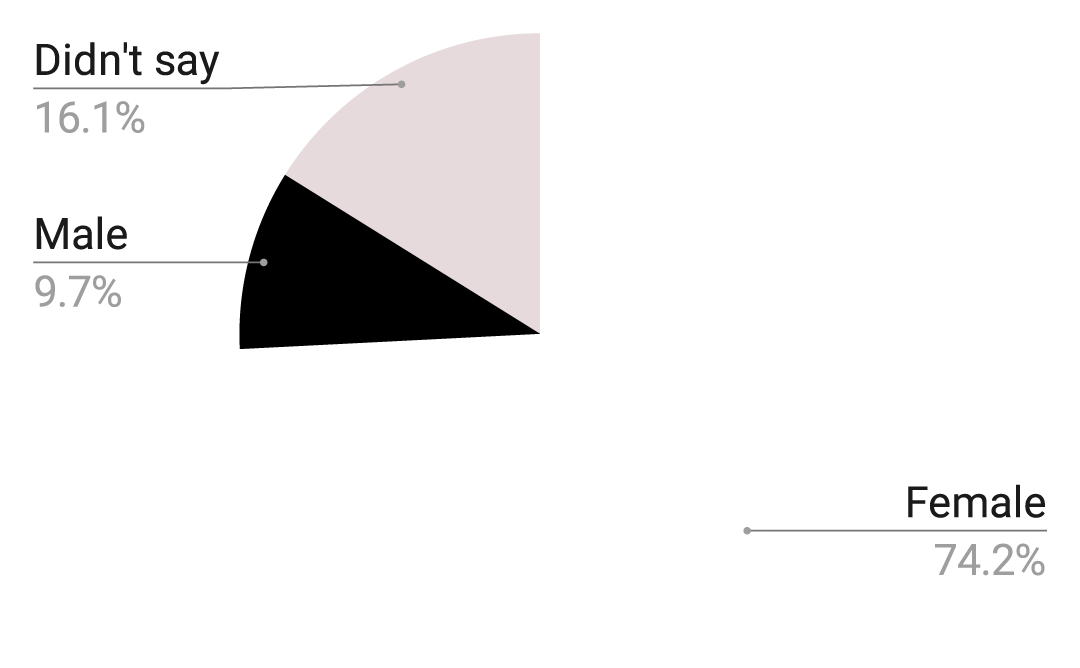
Contributors’ write-in responses followed gender binaries.
Ethnicity
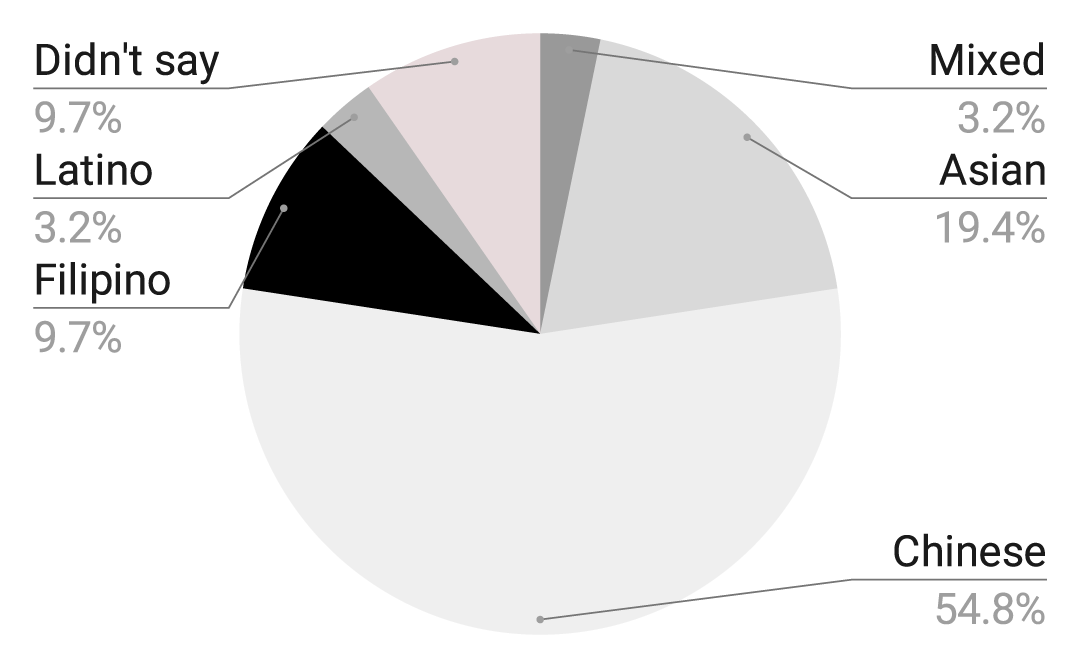
*Mixed indicates mixed race (50% Chinese). Chinese encompasses Chinese and Chinese American. Filipino includes Pilipino and Filipino American.
Language of Contributions
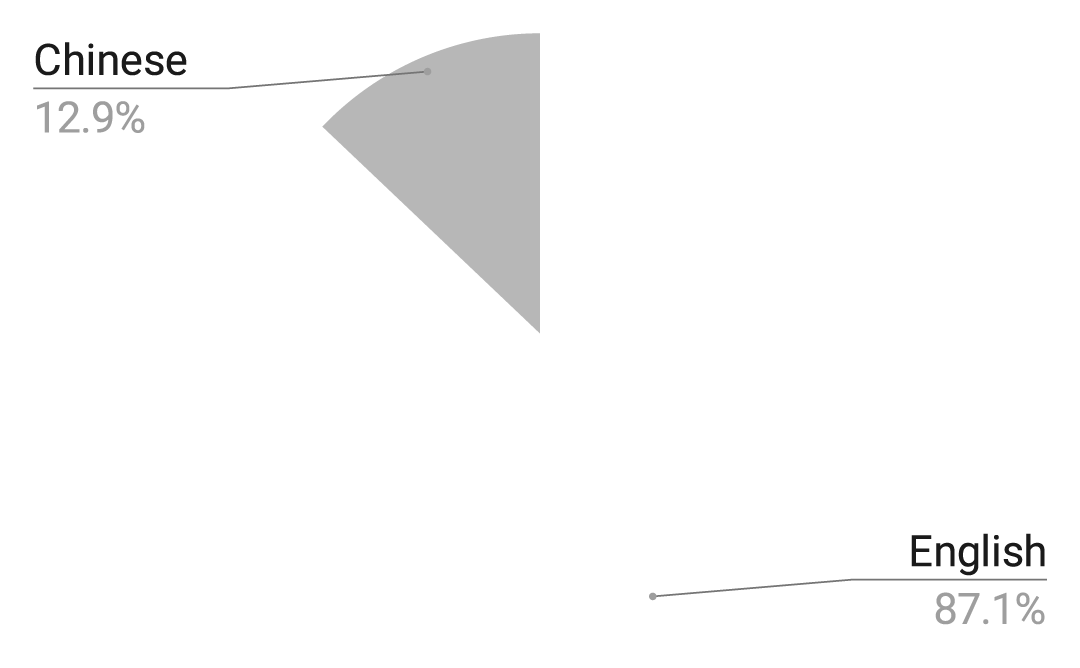
Contributors could respond in Chinese or English.
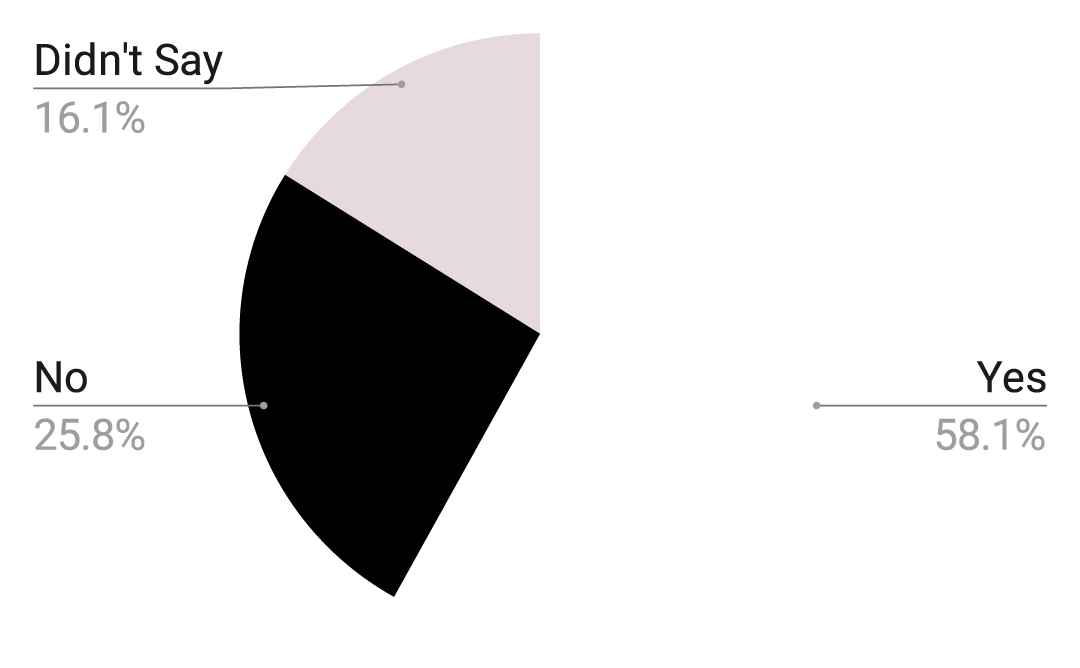
Do you identify as immigrants?
Geography

*Based on ZIP codes. Chinatown+ indicates Chinatown plus adjacent neighborhoods. SoCal indicates Southern California. Penninsula indicates San Mateo County.
Do you live in, work in, and/or visit Chinatown?

3 didn’t say
How long have you lived in/worked in/visited Chinatown?
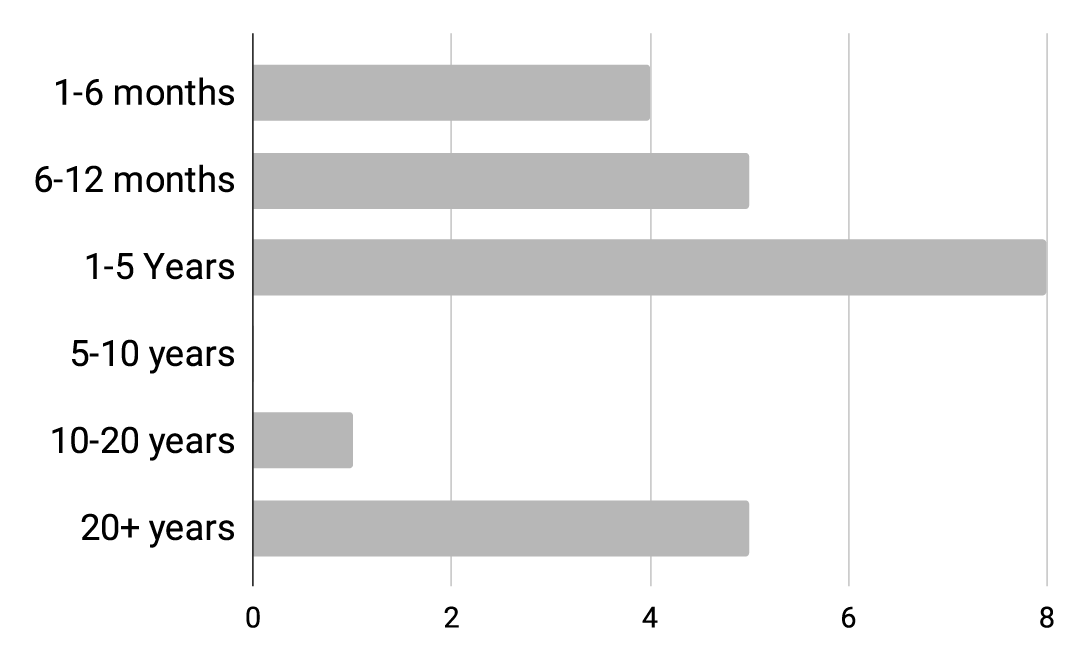
8 didn’t say